Flying back to Sydney the other day, my travel buddy, Greg, and I were talking about Hurricane Katrina. I had visited the museum when I was in New Orleans not too long ago and the images I saw, the stories I read, will live on with me. The lessons I learned as I walked through the carefully selected artefacts, photographs, drawings and news footage continue to influence the decision making and problem solving I apply every day to my incident management roles back here in Australia. **Side note – if you ever travel to NOLA, visit the museum. It is worth every penny. I highly recommend it to everyone.
During our discussion about the management of the incident, Greg asked, “Do you think it was a success?” My immediate answer was, “No!” Asked to explain further, I began to list off the extensive reasons why the management of Hurricane Katrina as an emergency incident was a disaster in itself. I talked about the lack of coordination between agencies, breakdown in basic communication, a letdown of accurate situational awareness and my most ardent opinion piece – the failure to establish effective and clear control by any agency until the arrival of Lieutenant General Honoré and the Army’s Joint Task Force.
When I was done, Greg spoke about the Hurricane Katrina death toll – 1,833. Approximately 986 of those were residents of New Orleans. The population at the time was recorded as 484,674. After some haphazard scratching on the napkin that came with the Virgin Australia cup of tea, and the eventual help of an iPhone calculator, I worked out that was 0.2%.
Given all we know about the situation – the impact in the 9th Ward, the hellish environment created in the SuperDome, the fact multiple levees were breached resulted in 80% of the town underwater, and damage to the city estimated at $US135billion…. The death toll could have been much, much higher.
The worst natural disaster in 2005 was the earthquake in the Azad Kashmir Region, Pakistan where 87,350 people perished. The population of the area was 2,973,000 give or take. That’s a 2.9% fatality rate. Compared against the Katrina statistic, suddenly Greg’s point is clear.
Of course, there are many external factors that influence those statistics – topography, type of hazard, infrastructure conditions, government etc. But, comparing the impact on the population numbers, perhaps Hurricane Katrina response might not have been entirely negative after all?
Additionally, maybe the lessons learned in Katrina helped prevent the deaths of others in subsequent hurricane incidents too?
Looking at statistics for hurricane fatalities after 2005 makes for interesting reading …
- Hurricane Irene in 2011 – approx. 49 people perished.
- Hurricane Isaac in 2012 – approx. 41 people passed away.
- Hurricane Nate in 2017 – approx. 45 people died.
We can be quick to judge the success or failure of our work based on a set of principles we’ve predetermined, either through formal key performance indicators or the bias of our own beliefs and values. If the measure of success for the Hurricane Katrina response effort was to keep as many people alive as possible, let’s say, less than 1% of the population, then there is good evidence to support great success.
If we decide that the measure of success is the provision of relief and recovery support to affected residents or establishing an effective command and control structure, then the Hurricane Katrina response effort was lacking significantly.
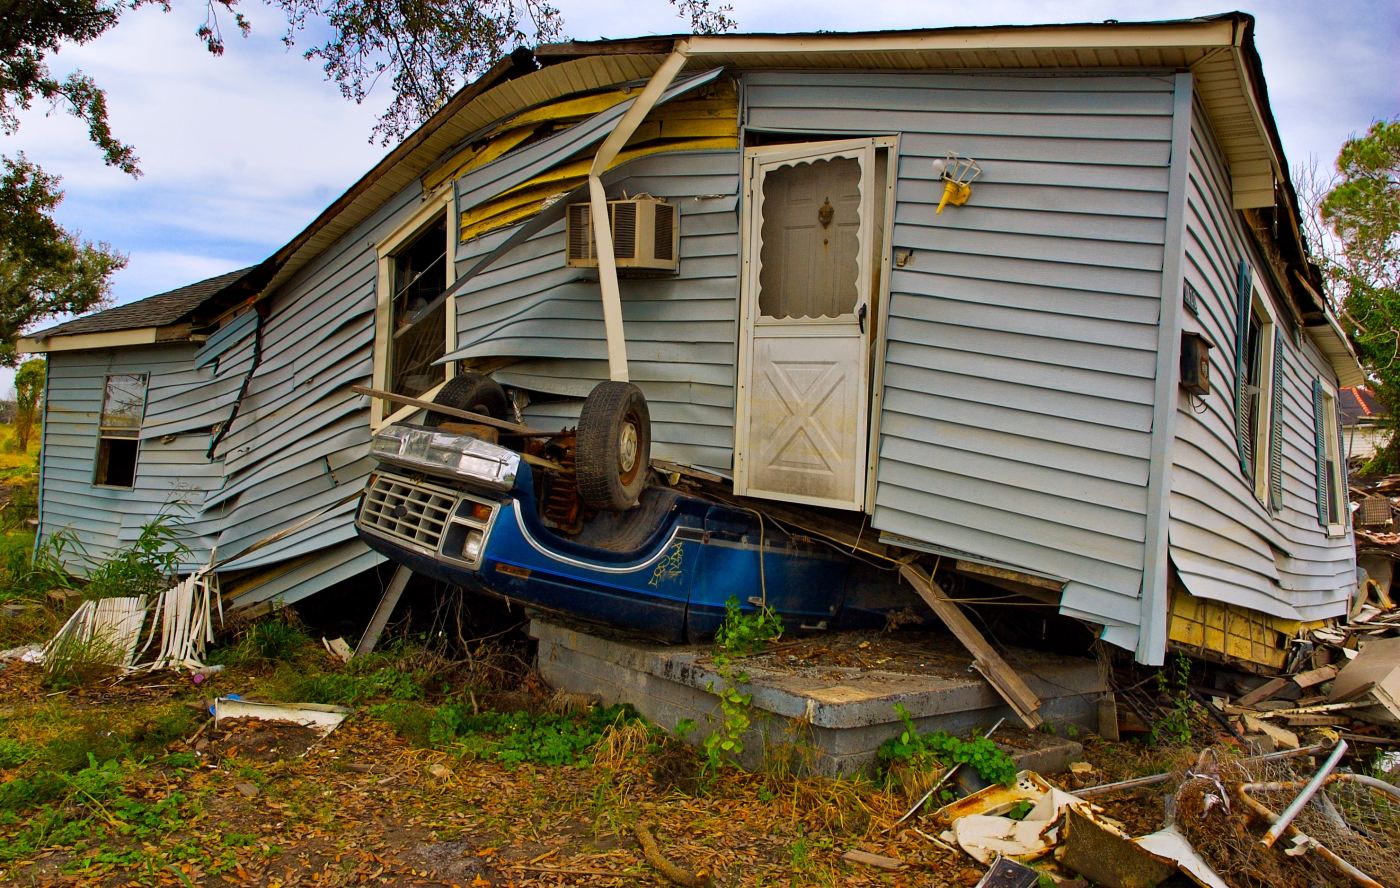
There are always going to be good and bad outcomes when we do what we do. It’s the nature of emergency management – we might save this house, only to lose the one next door. It’s easy to automatically jump to the critical part of analysing our action after the incident, focusing on what we could have done better. It is vitally important to look for the positive too. It will help encourage and support your teams to keep trying, and provide fuel for their actions next time.
Leadership Challenge:
Run an ‘After Action Review’ of an incident/job, training scenario or case study and only focus on positive analysis – no critique allowed. See how your team goes.
For those with limited knowledge of Hurricane Katrina, here is a National Geographic video of the timeline of the event:
The statistics used in this post were sourced from the following websites:

Leave a comment